Multiple Choice
The figure given below shows the consumption function of a household.?Figure 9.2
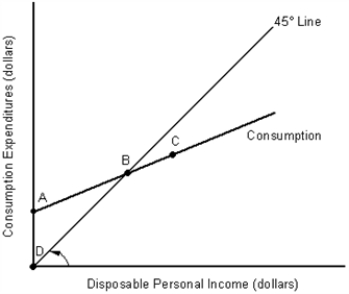
-In Figure 9.2, the line segment AD represents:
A) autonomous consumption.
B) the maximum amount of saving.
C) negative consumption.
D) zero consumption.
E) autonomous expenditure.
Correct Answer:

Verified
Correct Answer:
Verified
Q9: In the table given below Y
Q20: Suppose the marginal propensity to import for
Q24: Identify the correct statement with respect to
Q26: As disposable income rises:<br>A) consumption falls, but
Q59: When we assume that investment is autonomous
Q65: The figure given below shows the aggregate
Q67: Table 9.2<br> <span class="ql-formula" data-value="\begin{array}
Q68: If disposable income rises from $15, 000
Q83: The figure given below represents the consumption
Q87: As capacity utilization in an economy rises:<br>A)firms