Multiple Choice
The figure given below shows the consumption function of a household.?Figure 9.2
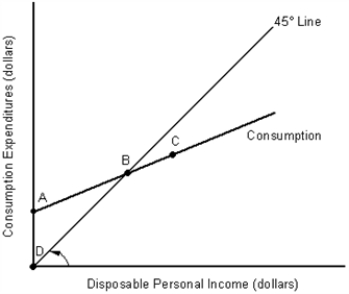
-In Figure 9.2, an increase in autonomous consumption would be illustrated by:
A) a movement from point A to point D.
B) a movement from point A to point B.
C) an upward shift of the consumption function.
D) a downward shift of the consumption function.
E) a movement from point C to point B.
Correct Answer:

Verified
Correct Answer:
Verified
Q28: The figure given below represents the consumption
Q46: In most derivations of the aggregate expenditures
Q66: The second-largest component of aggregate expenditures in
Q87: Table 9.2<br> <span class="ql-formula" data-value="\begin{array}
Q100: Suppose that the U.S.trade balance is positive.Hence,
Q103: The figure given below shows the consumption
Q104: A key assumption of the Keynesian model
Q105: The net export function illustrates that:<br>A) net
Q106: When disposable income is zero, consumption is
Q112: Other things equal, when Europeans want to