Multiple Choice
The figure given below represents the consumption function of a country.
Figure 9.3
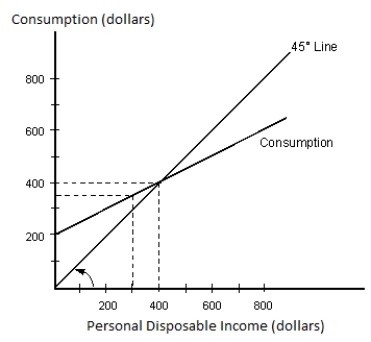
-According to Figure 9.3, saving is zero when disposable income is _____.
A) $0
B) $400
C) $250
D) $800
E) $300
Correct Answer:

Verified
Correct Answer:
Verified
Related Questions
Q23: When the U.S.government removes investment tax credits:<br>A)consumption
Q31: The figure given below shows the consumption
Q32: In the table given below Y
Q33: The table given below reports the
Q38: Other things equal, when the U.S.dollar depreciates,
Q51: When capacity utilization rate is high:<br>A)the price
Q101: Suppose total disposable income in Country X
Q103: A change in consumption caused by a
Q105: The United States introduced investment tax credit
Q107: A change in the marginal propensity to