Multiple Choice
The figure given below represents the consumption function of a country.?Figure 9.3
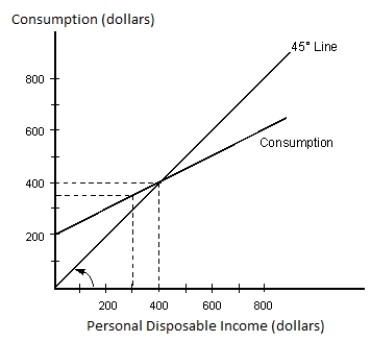
-Refer to Figure 9.3. The savings function of the country will have a positive intercept at all income levels _____.
A) less than $200
B) greater than $200
C) less than $600
D) greater than $400
E) less than $800
Correct Answer:

Verified
Correct Answer:
Verified
Q14: In the table given below Y
Q18: The table given below reports the
Q18: Other things equal, a marginal propensity to
Q49: An increase in the marginal propensity to
Q50: A change in consumption caused by a
Q56: The amount of autonomous consumption in an
Q60: The consumption function illustrates that:<br>A)saving increases as
Q101: Suppose total disposable income in Country X
Q108: Which of the following factors will not
Q115: If a household experiences a $880 increase