Multiple Choice
The figure given below shows the aggregate expenditures function of an economy.?Figure 9.5
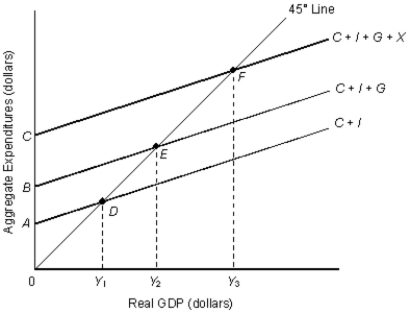
-Refer to Figure 9.5. The amount of government spending is indicated by the distance _____.
A) Y₁Y₂
B) EF
C) Y₂Y₃
D) BC
E) AB
Correct Answer:

Verified
Correct Answer:
Verified
Q17: Which of the following would cause a
Q20: Changes in autonomous consumption will affect the
Q28: The figure given below represents the consumption
Q65: Which of the following statements is true?<br>A)Real
Q66: The second-largest component of aggregate expenditures in
Q90: The 45-degree line used in a consumption
Q100: Suppose that the U.S.trade balance is positive.Hence,
Q106: When disposable income is zero, consumption is
Q112: Other things equal, when Europeans want to
Q118: The table given below reports the consumption