Multiple Choice
The figure given below shows the aggregate expenditures function of an economy.?Figure 9.5
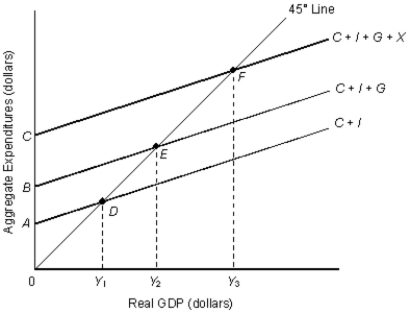
-Refer to figure 9.5. The slope of the aggregate expenditures function (AE) is flatter than the C+I+G function because:
A) the marginal propensity to consume is ususally less than 1.
B) the marginal propensity to import is greater than 1.
C) the slope of the net exports function is negative.
D) investment(I) and government spending(G) are assumed to be autonomous.
E) there is a leakage from the aggregate expenditures function in the form of savings.
Correct Answer:

Verified
Correct Answer:
Verified
Q10: Autonomous consumption is defined as:<br>A) the level
Q13: An MPI of 0.4 indicates that for
Q32: Consumption, saving, and wealth all represent stock
Q39: Other things equal, a decrease in the
Q42: The part of the disposable income that
Q58: As a function of real GDP (real
Q59: When we assume that investment is autonomous
Q87: As capacity utilization in an economy rises:<br>A)firms
Q105: The figure given below represents the saving
Q107: A change in the marginal propensity to