Multiple Choice
The figure given below depicts the demand and supply of Brazilian reals in the foreign exchange market. Assume that the market operates under a flexible exchange rate regime.
Figure 21.1
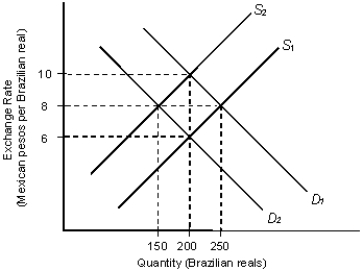
In the figure:
D1 and D2: Demand for Brazilian reals
S1 and S2: Supply of Brazilian reals
-Refer to Figure 21.1. The demand curves shown for Brazilian reals are based on:
A) the supply of Brazilian reals in the market.
B) the demand for Mexican pesos.
C) Brazilian demand for Brazilian products.
D) Brazilian demand for Mexican products.
E) Mexican demand for Brazilian products.
Correct Answer:

Verified
Correct Answer:
Verified
Q2: Suppose a U.S.firm buys a one-year U.K.bond
Q4: The figure below shows the demand (D)
Q26: The figure given below depicts the foreign
Q28: If a dollar invested in the United
Q60: The figure given below depicts the foreign
Q67: The figure below shows the demand (D)
Q68: The figure given below depicts the foreign
Q78: Assume that a country's government influences the
Q82: The figure given below depicts the foreign
Q101: The figure below shows the demand (D)