Multiple Choice
The figure given below depicts the foreign exchange market for British pounds traded for U.S. dollars.?Figure 21.2
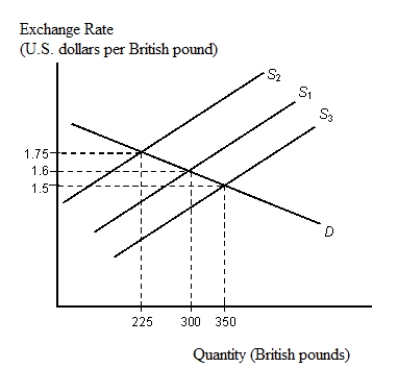
-Refer to Figure 21.2. At the initial equilibrium point, with demand curve D and supply curve S₁:
A) the price of dollar per British pound is $1.50 and the quantity of British pounds being traded is 225.
B) the price of dollar per British pound is $1.60 and the quantity of British pounds being traded is 225.
C) the price of dollar per British pound is $1.60 and the quantity of British pounds being traded is 300.
D) the price of dollar per British pound is $1.75 and the quantity of British pounds being traded is 350.
E) the price of dollar per British pound is $1.75 and the quantity of British pounds being traded is 300.
Correct Answer:

Verified
Correct Answer:
Verified
Q18: The figure given below depicts the foreign
Q55: Suppose you are a U.S. exporter expecting
Q63: The figure given below depicts the foreign
Q65: The figure given below depicts the foreign
Q74: The figure given below depicts the foreign
Q76: The figure given below depicts the demand
Q106: The figure below shows the demand (D)
Q108: The figure given below depicts the foreign
Q115: The figure given below depicts the foreign
Q128: The figure below shows the demand (D)