Multiple Choice
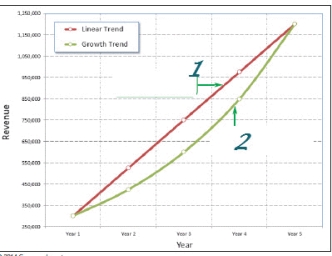
-As shown in the accompanying figure,when plotted,a(n) _______ trend displays the greatest increases near the end of the series.
A) periodic
B) growth
C) orthogonal
D) linear
Correct Answer:

Verified
Correct Answer:
Verified
Related Questions
Q83: The _ function takes only these arguments:
Q84: MATCHING<br>Identify the letter of the choice that
Q85: The PMT value is also known as
Q86: A(n)_ cash flow occurs whenever money is
Q87: When you extrapolate a series,you do not
Q89: Most Excel financial functions require a particular
Q90: The _ function calculates the number of
Q91: Charles is having a lot of problems
Q92: To calculate the number of quarterly payments
Q93: The _ period is a quick method