Multiple Choice
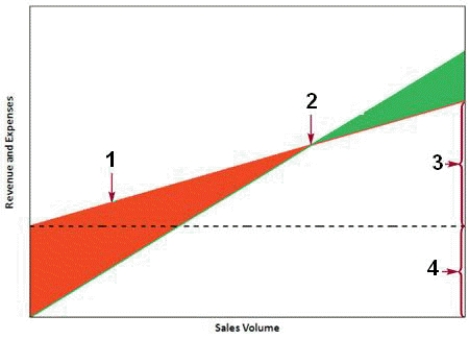
-The accompanying figure is a typical _______ chart.
A) AVP
B) CVP
C) EVP
D) MVP
Correct Answer:

Verified
Correct Answer:
Verified
Related Questions
Q46: To open the Goal Seek dialog box,first
Q47: <span class="ql-formula" data-value="\underline {\text { Variable }
Q48: CVP analysis is sometimes called
Q49: A limits report allows you to quantify
Q50: <img src="https://d2lvgg3v3hfg70.cloudfront.net/TB2166/.jpg" alt=" -The item marked
Q52: To set up a(n)_ table,you first insert
Q53: The answer report is divided into _
Q54: A scenario summary report's _ layout makes
Q55: In traditional what-if analysis,you change
Q56: All three expense types can be classified