Multiple Choice
Review the following graph. What is the incidence of acute hepatitis A rate trend from 2000 to 2010 among all age groups? 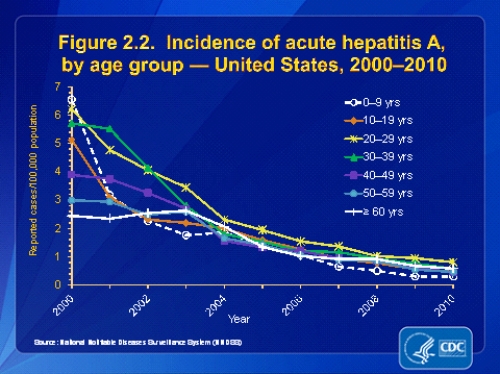
A) Downward
B) Upward
C) Horizontal
D) Vertical
Correct Answer:

Verified
Correct Answer:
Verified
Related Questions
Q9: _ is a method of sampling a
Q10: Calculate the average length of stay
Q11: Use the data below to calculate
Q12: The blood pressure of patients discharged in
Q13: In 2012, Comfort Community Hospital had 150
Q15: Which of the following graphs would best
Q16: Which statement best describes the patient abstract?<br>A)
Q17: Review the following graph. Which race/ethnicity has
Q18: The blood pressure of patients discharged in
Q19: Richard S. was admitted to the hospital