Multiple Choice
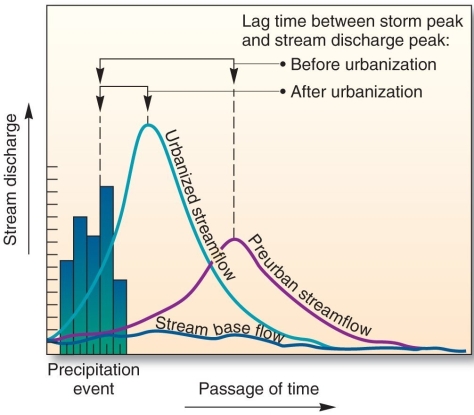
This graph, showing the effects of urbanization on streamflow over time, is an example of a
A) water budget.
B) hydrograph.
C) climograph.
D) hydrological cycle.
Correct Answer:

Verified
Correct Answer:
Verified
Related Questions
Q58: _ streams have some groundwater input, but
Q59: Maximum velocity in a straight channel is
Q60: A stream becomes graded when<br>A) erosion and
Q61: The high ground that separates one valley
Q62: Peak flows refers to the highest discharge
Q64: Which of the following lists of processes
Q65: Processes that are related expressly to streams
Q66: Which of the following will favor stream
Q67: The main process contributing material in solution
Q68: Alluvial fans are formed as flowing water