Multiple Choice
Consider the clustered bar chart of the dashboard developed to monitor the performance of a call center: 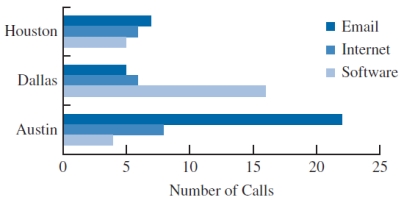
This chart allows the IT manager to
A) identify a particular type of problem by the call volume.
B) identify a particular type of problem by location.
C) identify different types of problems (Email, Internet, or Software) in the call center.
D) identify the frequency of each problem in the call center.
Correct Answer:

Verified
Correct Answer:
Verified
Q17: A useful chart for displaying multiple variables
Q18: A PivotChart, in few instances, is same
Q19: The data dashboard for a marketing manager
Q20: _ are visual methods of displaying data.<br>A)
Q21: The charts that are helpful in making
Q23: Consider the following survey results regarding marital
Q24: An effective way to show both trend
Q25: Data-ink is the ink used in a
Q28: A _ is a graphical presentation of
Q39: The software package most commonly used for