Essay
Consider the below table and the line chart on the temperatures in 11 different states of the United States:

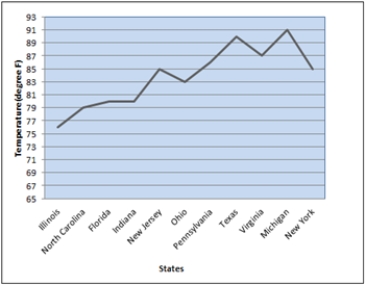
a. What are the problems with the layout and display of this line chart?
b. Create a new line chart for the given data. Format the chart to make it easy to read and interpret.
Correct Answer:

Verified
a. The chart contains unnecessary gridli...View Answer
Unlock this answer now
Get Access to more Verified Answers free of charge
Correct Answer:
Verified
View Answer
Unlock this answer now
Get Access to more Verified Answers free of charge
Q5: A _ is used for examining data
Q15: We create multiple dashboards<br>A)to help the user
Q37: In order to visualize three variables in
Q38: The data on the runs scored in
Q40: A chart similar to a scatter chart,
Q43: A crosstabulation in Microsoft Excel is known
Q44: The data on the distance walked per
Q45: A consumer electronics company, after three months
Q46: A summary on commodities below lists the
Q47: A disadvantage of a stacked column and