Multiple Choice
The following scatter chart would help conclude that: 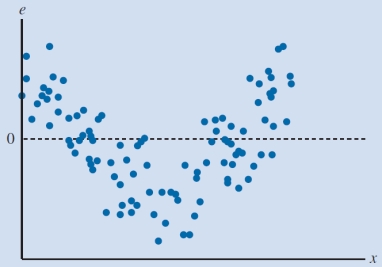
A) the residuals have a constant variance.
B) the model fails to capture the relationship between the variables accurately.
C) the model underpredicts the value of the dependent variable for intermediate values of the independent variable.
D) the residual is normally distributeD)
Correct Answer:

Verified
Correct Answer:
Verified
Q18: A _ is used to visualize sample
Q21: The difference between the observed value of
Q22: Assessing the regression model on data other
Q25: _ is the data set used to
Q50: A linear regression analysis for which any
Q52: A survey is conducted to determine whether
Q54: The data shown below are the average
Q57: _ is used to test the hypothesis
Q58: Which of the following inferences can be
Q59: The data on profit and market capitalization