Multiple Choice
Which of the following data patterns best describes the scenario shown in the below plot? 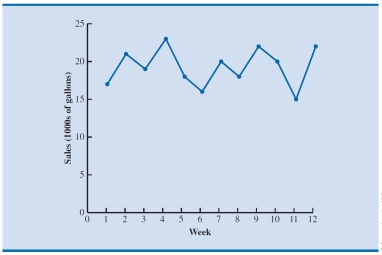
A) Time series with a linear trend pattern
B) Time series with a nonlinear trend pattern
C) Time series with no pattern
D) Time series with a horizontal pattern
Correct Answer:

Verified
Correct Answer:
Verified
Q4: The following data shows the quarterly profit
Q4: For causal modeling, _ are used to
Q5: The below time series gives the indices
Q6: Which of the following states the objective
Q7: Consider the following time series:<br> <img src="https://d2lvgg3v3hfg70.cloudfront.net/TB1880/.jpg"
Q8: Which of the following statements is the
Q10: Consider the following quarterly time series:<br> <img
Q11: The following times series shows the demand
Q12: Consider the following time series:<br> <img src="https://d2lvgg3v3hfg70.cloudfront.net/TB1880/.jpg"
Q26: A time series that shows a recurring