Multiple Choice
Which of the following data patterns best describes the scenario shown in the given time series plot? 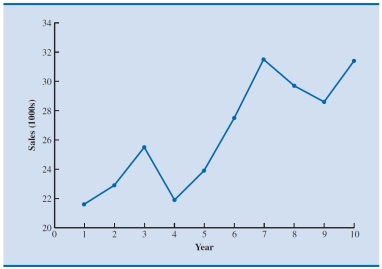
A) Linear trend pattern
B) Nonlinear trend pattern
C) Seasonal pattern
D) Cyclical pattern
Correct Answer:

Verified
Correct Answer:
Verified
Related Questions
Q3: A set of observations on a variable
Q14: Which of the following is true of
Q18: If the forecasted value of the time
Q32: Causal models<br>A)provide evidence of a causal relationship
Q33: Which of the following measures of forecast
Q36: Consider the following time series data:<br> <img
Q41: _ uses a weighted average of past
Q42: Forecast error:<br>A) takes a positive value when
Q43: A _ pattern exists when the data
Q44: A causal model provides evidence of _