Multiple Choice
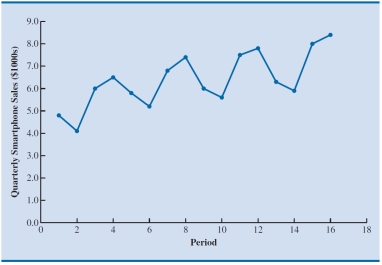
Which of the following data patterns best describes the scenario shown in the given time series plot? 
A) Linear trend and cyclical pattern
B) Linear trend and horizontal pattern
C) Seasonal and cyclical patterns
D) Seasonal pattern and linear trend
Correct Answer:

Verified
Correct Answer:
Verified
Related Questions
Q18: If the forecasted value of the time
Q36: The exponential smoothing forecast for period t
Q38: With reference to exponential forecasting models, a
Q47: The monthly market shares of General Electric
Q49: _ is the term used for a
Q49: The process of _ might be used
Q50: Consider the following time series data:<br> <img
Q53: The moving averages method refers to a
Q54: Consider the following time series data:<br> <img
Q55: The moving averages and exponential smoothing methods