Essay
To examine the local housing market in a particular region, a sample of 120 homes sold during a year are collected. The data is given below.

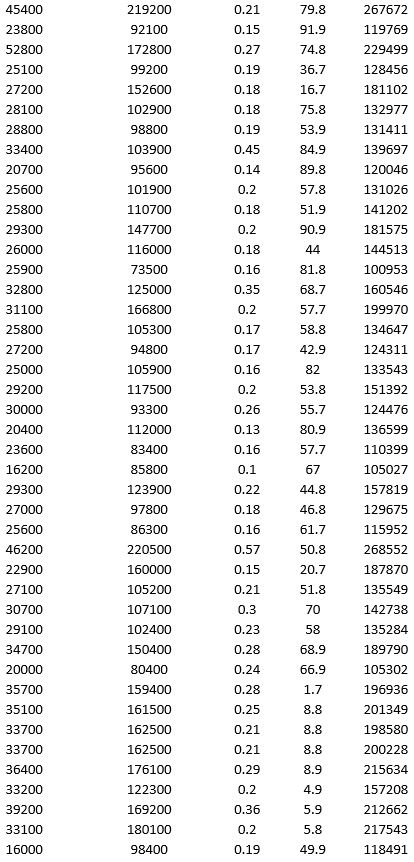
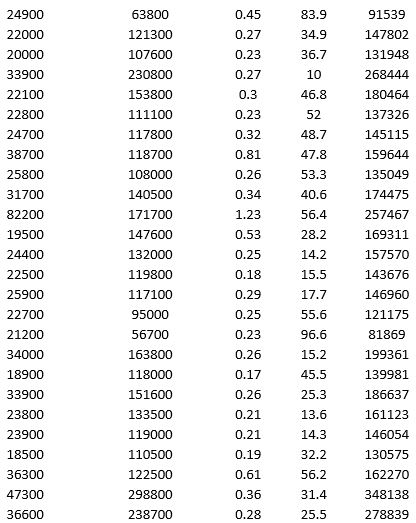
a. Apply hierarchical clustering with 10 clusters using LandValue ($), BuildingValue ($), Acres, Age, and Price ($) as variables. Be sure to Normalize input data in Step 2 of the XLMiner Hierarchical Clustering procedure, and specify complete linkage as the clustering method. Analyze the resulting clusters by computing the cluster size. It may be helpful to use a PivotTable on the data in the HC_Clusters worksheet generated by XLMiner. You can also visualize the clusters by creating a scatter plot with Acre as the x-variable and Price ($) as the y-variable.
b. Repeat part a using average group linkage as the clustering method. Compare the clusters to the previous method.
Correct Answer:

Verified
a. Complete linkage results in clusters ...View Answer
Unlock this answer now
Get Access to more Verified Answers free of charge
Correct Answer:
Verified
View Answer
Unlock this answer now
Get Access to more Verified Answers free of charge
Q29: A tree diagram used to illustrate the
Q37: Which of the following is a commonly
Q40: _ can be used to partition observations
Q49: To examine the local housing market in
Q51: Separate error rates with respect to the
Q52: _methods do not attempt to predict an
Q53: The data preparation technique used in market
Q56: Which of the following methods is used
Q57: To examine the local housing market in
Q58: _ is the process of estimating the