Essay
A bank wants to understand better the details of customers who are likely to default the loan. In order to analyze this, the data from a random sample of 200 customers are given below:

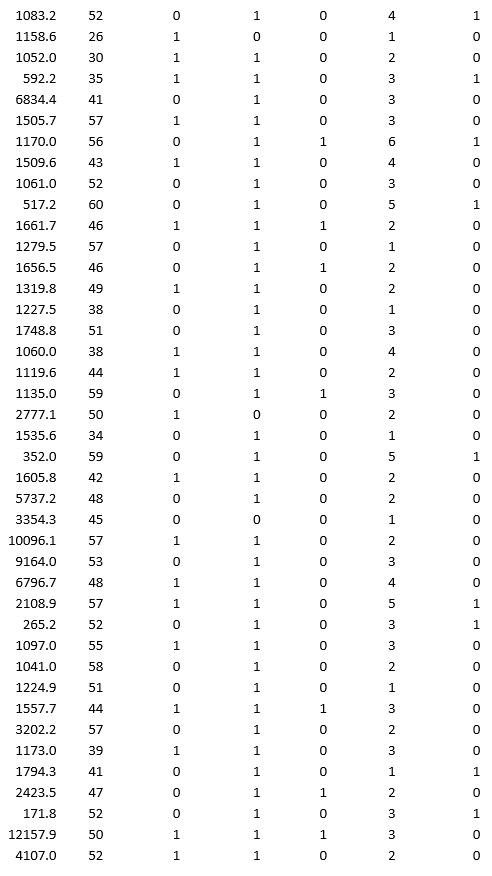
In XLMiner's Partition with Oversampling procedure, partition the data so there is 50 percent successes (Loan default) in the training set and 40 percent of the validation data is taken away as test data. Classify the data using k-nearest neighbors with up to k = 10. Use Loan default as the output variable and all the other variables as input variables. In Step 2 of XLMiner's k-nearest neighbors Classification procedure, be sure to Normalize input data and to Score on best k between 1 and specified value. Generate lift charts for both the validation data and test data.
a. For the cutoff probability value 0.5, what value of k minimizes the overall error rate on the validation data?
b. What is the overall error rate on the test data? Interpret this measure.
c. What are the Class 1 error rate and the Class 0 error rate on the test data?
d. Compute and interpret the sensitivity and specificity for the test data.
e. Examine the decile-wise lift chart on the test data. What is the first decile lift on the test data? Interpret this value.
Correct Answer:

Verified
a. A value of k = 1 minimizes the overal...View Answer
Unlock this answer now
Get Access to more Verified Answers free of charge
Correct Answer:
Verified
View Answer
Unlock this answer now
Get Access to more Verified Answers free of charge
Q1: Observation refers to the<br>A)estimated continuous outcome variable.<br>B)set
Q14: An analysis of items frequently co-occurring in
Q15: As part of the quarterly reviews, the
Q16: The lift ratio of an association rule
Q17: As part of the quarterly reviews, the
Q17: The impurity of a group of observations
Q19: As part of the quarterly reviews, the
Q23: A sample is representative of the entire
Q38: _ refers to the scenario in which
Q45: In which of the following data-mining process