Essay
A research team wanted to assess the relationship between age, systolic blood pressure, smoking, and risk of stroke. A sample of 150 patients who had a stroke is selected and the data collected are given below. Here, for the variable Smoker, 1 represents smokers and 0 represents nonsmokers.

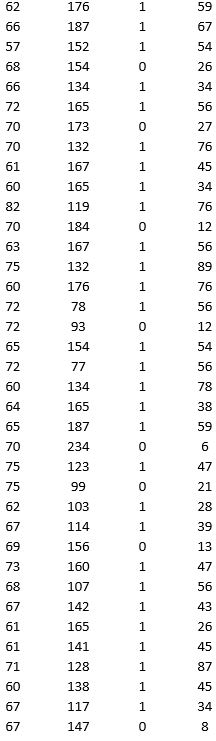
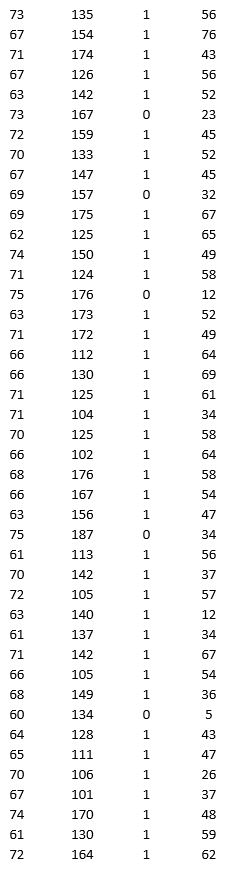
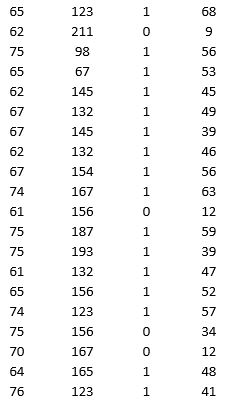
Partition the data into training (50 percent), validation (30 percent), and test (20 percent) sets. Predict the Risk of stroke using k-nearest neighbors with up to k = 20. Use Risk as the output variable and all the other variables as input variables. In Step 2 of XLMiner's k-Nearest Neighbors Prediction procedure, be sure to Normalize input data and to Score on best k between 1 and specified value. Generate a Detailed Scoring report for all three sets of data.
a. What value of k minimizes the root mean squared error (RMSE) on the validation data?
b. What is the RMSE on the validation data and test data?
c. What is the average error on the validation data and test data? What does this suggest?
Correct Answer:

Verified
a. A value of k = 10 minimizes the RMSE ...View Answer
Unlock this answer now
Get Access to more Verified Answers free of charge
Correct Answer:
Verified
View Answer
Unlock this answer now
Get Access to more Verified Answers free of charge
Q8: Test set is the data set used
Q11: In which of the following scenarios would
Q30: _ is a measure of calculating dissimilarity
Q30: _ is a measure of the heterogeneity
Q37: To examine the local housing market in
Q38: The endpoint of a k-means clustering algorithm
Q42: Jaccard's coefficient is different from the matching
Q43: A bank is interested in identifying different
Q44: A cluster's _ can be measured by
Q45: To examine the local housing market in