Multiple Choice
Reference - 10.3: Use the graph given below to answer questions
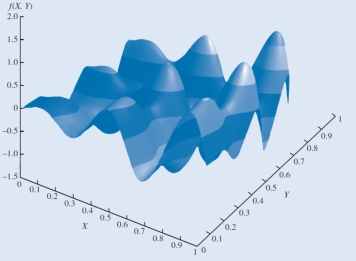
-Reference - 10.3. The feasible region for the function represented in the graph is:
A) -1 ≤ X ≤ 1, -1 ≤ Y ≤ 1.
B) -1.5 ≤ X ≤ 1, 0 ≤ Y ≤ ∞.
C) -1.5 ≤ X ≤ 2.0, -1.5 ≤ Y ≤ 2.0.
D) 0 ≤ X ≤ 1, 0 ≤ Y ≤ 1.
Correct Answer:

Verified
Correct Answer:
Verified
Q12: In the Bass forecasting model, parameter m<br>A)measures
Q13: If there are no other feasible solutions
Q23: One of the ways to formulate the
Q30: If all the squared terms in a
Q32: A global minimum<br>A)is also a local maximum.<br>B)need
Q33: Mark and his friends are planning
Q34: Consider the stock return data given below.<br>
Q37: Reference - 10.2: Use the graph given
Q39: Gatson manufacturing company is willing to promote
Q40: Reference - 10.1: Use the graph given