Multiple Choice
Exhibit 5.2
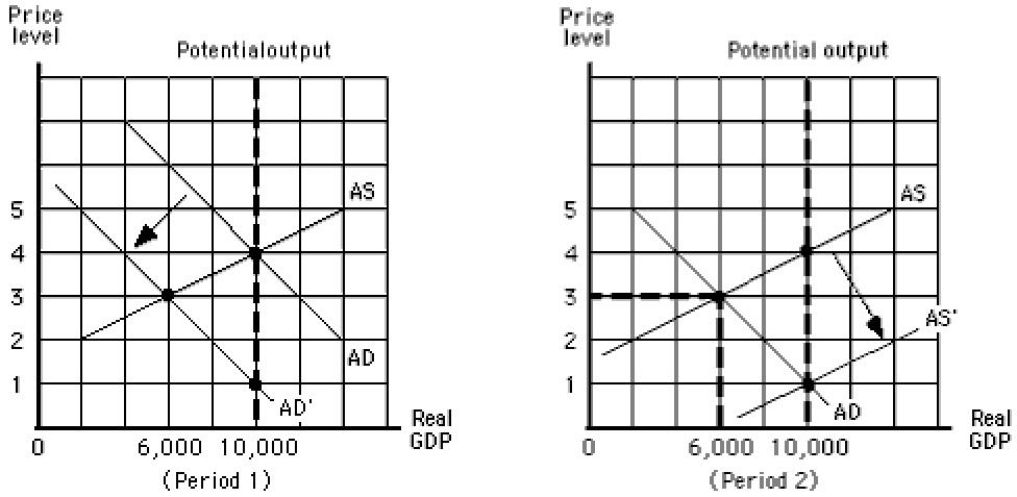
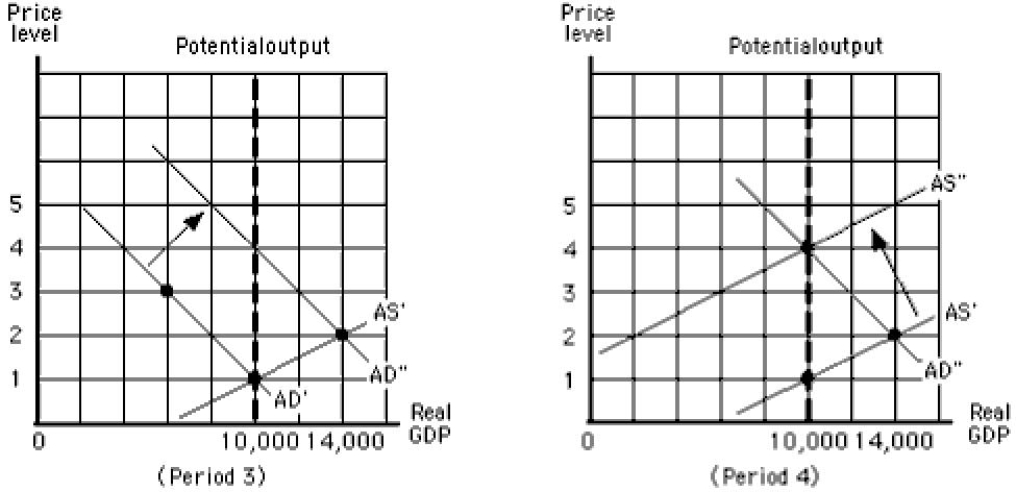
-Refer to Exhibit 5.2, which shows the aggregate demand and supply curves for the United States. Between period 1 and period 2, nominal GDP changed from $40,000 to:
A) $18,000 in period 1 and went back to $40,000 in period 2.
B) $18,000 in period 1 and stayed there in period 2.
C) $18,000 in period 1 and to $10,000 in period 2.
D) $10,000 in period 1 and stayed there in period 2.
E) $10,000 in period 1 and to $18,000 in period 2.
Correct Answer:

Verified
Correct Answer:
Verified
Q12: A period of sustained decline in output
Q56: The market value of all final goods
Q81: The Keynesian approach to government economic policy:<br>A)has
Q104: The aggregate supply curve represents:<br>A)the quantity of
Q145: According to Keynes,if private sector demand is
Q148: The word stagflation describes a situation in
Q161: Which of the following is most likely
Q165: In the history of the U.S. economy,
Q167: On a graph showing the aggregate demand
Q170: Exhibit 5.2<br><br> <img src="https://d2lvgg3v3hfg70.cloudfront.net/TB1006/.jpg" alt="Exhibit 5.2