Multiple Choice
Exhibit 10.1
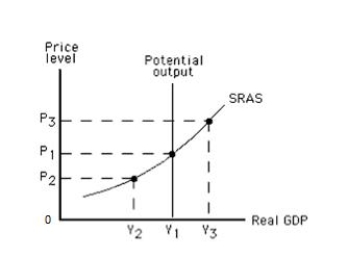
-Refer to Exhibit 10.1, which shows the short-run aggregate supply (SRAS) curve of an economy. At Y₂, _____
A) output levels are at the economy's potential.
B) output levels are more than the economy's potential.
C) unemployment is at the natural rate.
D) unemployment is higher than the natural rate.
E) unemployment is lower than the natural rate.
Correct Answer:

Verified
Correct Answer:
Verified
Q18: The potential output of an economy is:<br>A)the
Q44: Which of the following supply shocks would
Q81: At the potential level of output,there is
Q85: If global pollution causes climatic changes that
Q101: If nominal wage rates increase by 2
Q122: The longer the unemployment rate remains above
Q152: Which of these is most likely to
Q153: Exhibit 10.3<br> <img src="https://d2lvgg3v3hfg70.cloudfront.net/TB1006/.jpg" alt="Exhibit 10.3
Q156: What is the relationship between wages and
Q160: If the actual price level is less