Multiple Choice
Exhibit 10.1
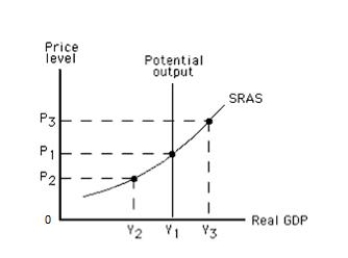
-Refer to Exhibit 10.1, which shows the short-run aggregate supply curve of an economy. In this Exhibit, a recessionary gap would be represented by the distance between _____
A) Y₁ and Y₂.
B) Y₁ and Y₃.
C) Y₂ and Y₃.
D) P₃ and P₁.
E) P₃ and P₂.
Correct Answer:

Verified
Correct Answer:
Verified
Q73: The potential output of an economy is
Q85: If global pollution causes climatic changes that
Q101: If nominal wage rates increase by 2
Q145: Which of these changes is observed in
Q146: Exhibit 10.1<br> <img src="https://d2lvgg3v3hfg70.cloudfront.net/TB1006/.jpg" alt="Exhibit 10.1
Q147: Suppose the actual and expected price levels
Q148: How much is the output gap if
Q151: Exhibit 10.2<br> <img src="https://d2lvgg3v3hfg70.cloudfront.net/TB1006/.jpg" alt="Exhibit 10.2
Q152: Which of these is most likely to
Q153: Exhibit 10.3<br> <img src="https://d2lvgg3v3hfg70.cloudfront.net/TB1006/.jpg" alt="Exhibit 10.3