Multiple Choice
Exhibit 10.8
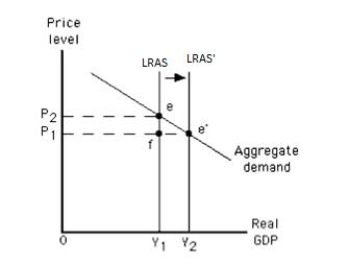
-Refer to Exhibit 10.8, which shows the long-run equilibrium in an aggregate demand-aggregate supply model. The change in real GDP in this exhibit from Y₁ to Y₂ could have been caused by _____
A) a government policy aimed at increasing demand.
B) a change in weather conditions that led to worldwide crop failures.
C) an attempt by key resource producers to monopolize supply.
D) an increase in taxation or a decrease in government spending.
E) an increase in labor productivity.
Correct Answer:

Verified
Correct Answer:
Verified
Q8: Given implicit or explicit resource price agreements,
Q9: Which of the following is true of
Q10: When the economy's actual price level exceeds
Q11: Exhibit 10.1<br> <img src="https://d2lvgg3v3hfg70.cloudfront.net/TB1006/.jpg" alt="Exhibit 10.1
Q14: Which of these is most likely to
Q15: Which of the following is true of
Q16: The short-run aggregate supply curve _<br>A) is
Q17: In the aggregate demand-aggregate supply model, which
Q18: Table 10.1<br> <span class="ql-formula" data-value="\begin{array}{l}\text
Q36: Which of these is an advantage of