Multiple Choice
Exhibit 15.2
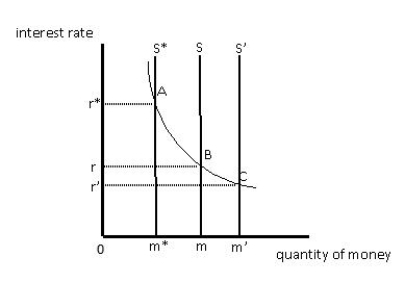
-Figure 15.2 shows equilibrium in a money market. If S is the initial supply curve, the movement from S to S* can be attributed to _____
A) a decrease in the required reserve ratio.
B) the purchase of U.S. Treasury securities by the Fed.
C) the sale of U.S. Treasury securities by the Fed.
D) a decrease in the discount rate.
E) a decrease in excess reserves in the banking system.
Correct Answer:

Verified
Correct Answer:
Verified
Q6: According to the equation of exchange,if real
Q20: People prefer to hold less of their
Q29: The opportunity cost of holding money is
Q50: If the short-run aggregate supply curve is
Q62: When the Fed purchases U.S.government securities through
Q106: Exhibit 15.1<br> <img src="https://d2lvgg3v3hfg70.cloudfront.net/TB1006/.jpg" alt="Exhibit 15.1
Q108: Exhibit 15.5<br> <img src="https://d2lvgg3v3hfg70.cloudfront.net/TB1006/.jpg" alt="Exhibit 15.5
Q110: Exhibit 15.4<br> <img src="https://d2lvgg3v3hfg70.cloudfront.net/TB1006/.jpg" alt="Exhibit 15.4
Q137: The quantity theory of money assumes that
Q150: If the Fed decreases the money supply,gross