Multiple Choice
Exhibit 15.5
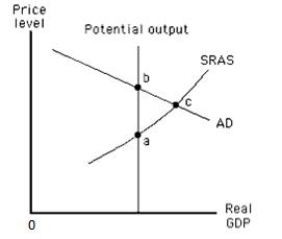
-Exhibit 15.5 depicts the aggregate demand curve and the short-run aggregate supply curve of an economy. In this figure, short-run equilibrium occurs at _____
A) point b, where actual output exceeds potential output.
B) point a, where actual output exceeds potential output.
C) point c, where the actual price level exceeds the expected price level.
D) point c, where the actual price level is less than the expected price level.
E) point b, where the actual price level exceeds the expected price level.
Correct Answer:

Verified
Correct Answer:
Verified
Q56: If real output and velocity are stable
Q71: According to the quantity theory of money,if
Q86: Which of these changes is likely to
Q100: An increase in the money supply leads
Q170: When the Fed decreases the money supply,
Q172: Exhibit 15.3<br> <img src="https://d2lvgg3v3hfg70.cloudfront.net/TB1006/.jpg" alt="Exhibit 15.3
Q174: If the velocity of money is 2
Q176: Which of the following is an example
Q179: Between 2007 and 2017, the CPI increased
Q180: If the money supply in an economy