Multiple Choice
The figure below is an example of data that are in: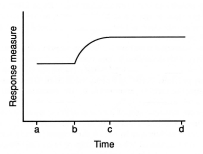
A) a steady state
B) a cycle
C) a transitory state
D) a transition state
Correct Answer:

Verified
Correct Answer:
Verified
Related Questions
Q18: _ is a measure of variability defined
Q19: A pattern of responding that shows relatively
Q20: Describe the value of the steady-state strategy
Q21: What is the main problem with the
Q22: The steady state strategy involves measuring responding
Q24: Describe the steady state strategy.
Q25: The most popular approach to determine stability
Q26: What are the two conclusions that stable
Q27: What are repeated measures of behavior? Why
Q28: Can a trend be considered stable responding?