Multiple Choice
When comparing the responding in the two phases depicted in the figure below, the proper interpretation of the second phase would be: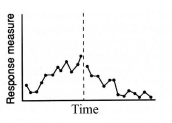
A) that the change in responding in the second phase may represent the effects of the condition itself plus extraneous variables present in the first phase
B) that the change in responding in the second phase is due to extraneous variables
C) that the change in responding in the second phase is due to the introduction of the new condition
D) that the change in responding in the second phase is due to the dependent variable
Correct Answer:

Verified
Correct Answer:
Verified
Q1: If you repeatedly exposed each subject to
Q2: If a researcher is measuring the duration
Q3: If data show that responding is unstable
Q4: How long should each phase of an
Q6: A _ is a repeating pattern of
Q7: Why is the graphical approach to determining
Q8: What is the difference between trend and
Q9: Explain how the steady state strategy facilitates
Q10: The steady-state strategy is valuable for all
Q11: Why is it important to distinguish between