Multiple Choice
Use the following to answer questions :
Refer to the table below.
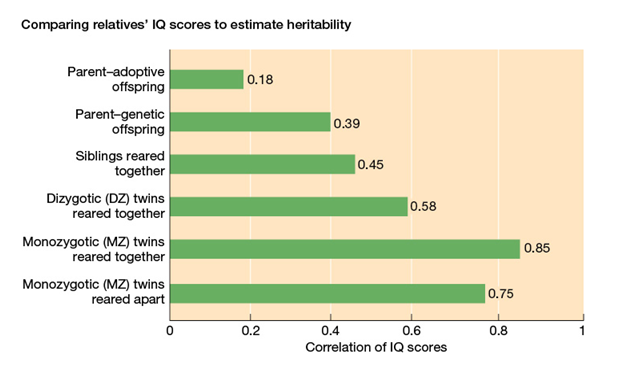
-What does this graph illustrate?
A) Estimates of the extent to which education affects IQ scores
B) The composite IQ scores of various relatives
C) Estimates of the extent to which IQ scores are heritable
D) The correlation of IQ scores among friends
Correct Answer:

Verified
Correct Answer:
Verified
Q84: By convention, children with IQ scores below
Q85: Which pair of family members is likely
Q86: The Binet-Simon scale was meant to reveal
Q87: When anyone in your family needs directions
Q88: _ is a process whereby every examiner
Q90: Explain why traits that are affected by
Q91: All of the following have been shown
Q92: Chris has memorized the names and uniform
Q93: Heritability estimates for IQ apply to _
Q94: The correlation of IQ scores for pairs