Multiple Choice
Five strains of the Staphylococcus aureus bacteria were grown for 24 hours either at 35 degrees Celsius or at 43 degrees Celsius. Here are the resulting bacterial counts for each condition:
Which of the following scatterplots is a correct representation of these data?
A) 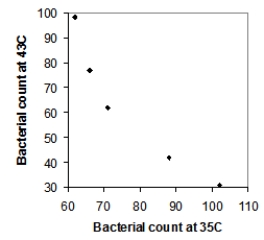
B) 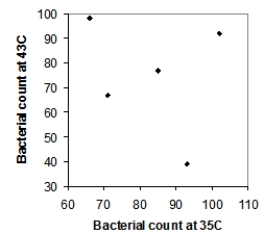
C) 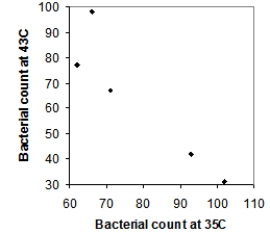
D) 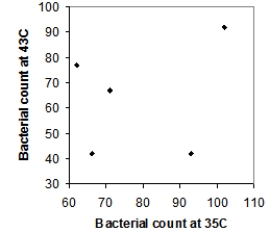
Correct Answer:

Verified
Correct Answer:
Verified
Q32: Bird species from temperate regions must cope
Q33: Does atmospheric pressure have an impact on
Q34: A research study of approximately 13,900 incoming
Q35: Tail-feather length in birds is sometimes
Q36: When water flows across farm land,
Q38: The following scatterplot shows heights (in centimeters)
Q39: Five strains of the Staphylococcus aureus
Q40: Tail-feather length in birds is sometimes
Q41: Five strains of the Staphylococcus aureus
Q42: Which of the following statements about correlation