Multiple Choice
Researchers investigated the effects of acute stress on emotional picture processing and recall by randomly assigning 40 adult males to receive either a stressful cold stimulus or a neutral warm stimulus before viewing pictures. The researchers computed the relative brainwave amplitude (in microvolts, μV) for each subject viewing unpleasant versus neutral pictures. They also recorded how many pictures the subjects were able to recall 24 hours later. The data are displayed in the following scatterplot.
μ 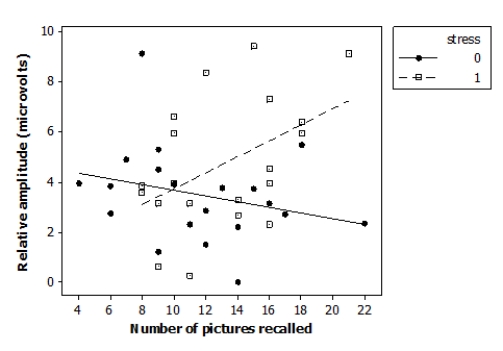 The following model is proposed for predicting the brainwave relative amplitude ("amplitude") from the number of images recalled ("recall") , the indicator variable reflecting the nature of the stimulus ("stress") , and an interaction term ("recall*stress") :
Amplitudei = β0 + β1 (recalli) + β2 (stressi) + β3 (recall*stressi) + εi
Where the deviations εi are assumed to be independent and Normally distributed with mean 0 and standard deviation σ. This model was fit to the sample of 40 adult males. The following results summarize the least-squares regression fit of this model:
Here are the residual plots for this regression model: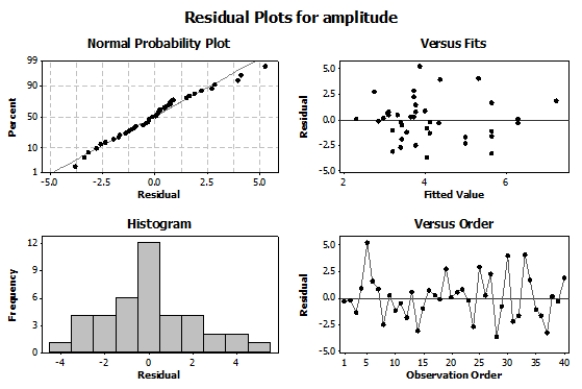 Based on the study description, the scatterplot, and the residual plots, what should you conclude?
A) The assumption of Normality is not met but the other assumptions are met.
B) The assumption of constant variance is not met but the other assumptions are met.
C) The assumption of independence is not met but the other assumptions are met.
D) All of the assumptions for regression inference are met.
Correct Answer:

Verified
Correct Answer:
Verified
Q5: A case study enrolled case individuals
Q6: Researchers investigated the effects of acute
Q7: Tail-feather length is a sexually dimorphic
Q8: A study looked for a protein
Q9: Researchers investigated the effects of acute
Q11: A case study enrolled case individuals
Q12: Researchers investigated the effects of acute
Q13: Tail-feather length is a sexually dimorphic
Q14: Researchers investigated the effects of acute
Q15: A study looked for a protein