Multiple Choice
Does the environment affect bird weight? Researchers measured the weight (in grams) of male and female adult finches that were either raised in an aviary or caught in the wild. This observational study does not have a balanced design, particularly because finches caught in the wild were more difficult to obtain. A total of 52 finches were studied. A partial ANOVA table is provided below, along with an interaction plot displaying the group means.
S = 1.61465 R-Sq = 23.88% R-Sq(adj) = 19.12%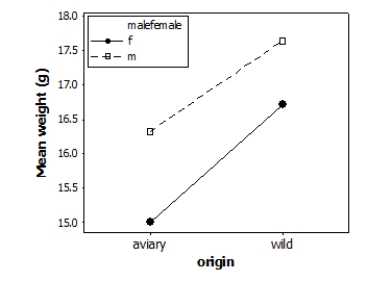 (Note: If you are using Table F rather than technology, select the nearest degrees of freedom in the table, not necessarily the most conservative value.)
What is the P-value for the main effect due to the birds' origin?
A) Greater than 0.10
B) Between 0.05 and 0.10
C) Between 0.01 and 0.05
D) Less than 0.01
Correct Answer:

Verified
Correct Answer:
Verified
Q27: Researchers are interested in the effects
Q28: A study randomly assigned adult subjects
Q29: Tail-feather length in birds is sometimes
Q30: A surgeon is interested in studying
Q31: Researchers are interested in the effects
Q33: A surgeon is interested in studying
Q34: Researchers are interested in the effects
Q35: How much corn should be planted
Q36: Does the environment affect bird weight?
Q37: Does the environment affect bird weight?