Multiple Choice
Data on the water quality in the eastern United States were obtained by a researcher who wanted to ascertain whether the amount of particulates in water (ppm) could be used to accurately predict the water quality score. Suppose we use the following simple linear regression model:
Qualityi = α+ β× particulatesi + Ɛi
Where the deviations Ɛi are assumed to be independent and Normally distributed with mean 0 and standard deviation σ. This model was fit to the data using the method of least squares. The following results were obtained from statistical software based on a sample of size 61:
r2 = 0.005, s = 0.7896.
Here is a scatterplot of the amount of particulates versus water quality: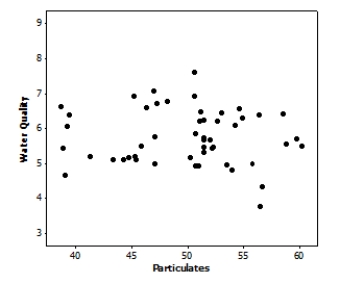 Which of the following statements is supported by the plot?
A) There is no striking evidence in the plot suggesting that the assumptions for regression are violated.
B) There appears to be a serious outlier in the plot, suggesting that our results must be interpreted with caution.
C) The plot contains dramatic evidence that the standard deviation of the response about the true regression line is not approximately the same everywhere.
D) The plot contains many fewer points than were used to fit the least-squares regression line in the previous problems.Obviously, there is a major error present.
Correct Answer:

Verified
Correct Answer:
Verified
Q29: Tail-feather length in birds is sometimes
Q30: Data on the water quality in
Q31: A researcher from the crop and
Q32: Tail-feather length in birds is sometimes
Q33: Before surgical removal of a diseased parathyroid
Q35: Tail-feather length in birds is sometimes
Q36: The slope βof the population regression line
Q37: Researchers examined hormonal changes in 39
Q38: Tail-feather length in birds is sometimes
Q39: A fisheries biologist has been studying