Multiple Choice
A company manufactures U-100 insulin syringes designed to contain 1 milliliter (ml) of a solution containing insulin. The actual distribution of solution volumes in these syringes is Normal, with mean? and standard deviation ?= 0.05 ml. We randomly select 8 syringes and measure the volume of solution in each. The results of these 8 measurements (in ml) are as follows
Do these data give evidence that the true population mean solution volume is not 1 m1? The P-value for the appropriate null and alternative hypotheses corresponds to which of the following shaded areas?
A) 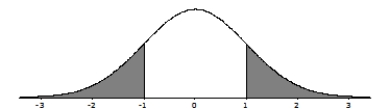
B) 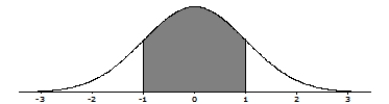
C) 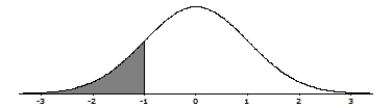
D) 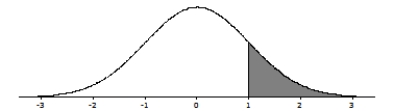
Correct Answer:

Verified
Correct Answer:
Verified
Q1: What is a level 0.90 confidence interval?<br>A)Any
Q2: The level of nitrogen oxides (NO<sub>x</sub>) in
Q3: A 95% confidence interval for the mean
Q4: A company manufactures U-100 insulin syringes
Q5: A 99% confidence interval for the mean
Q7: Suppose the time that it takes for
Q8: You conduct a statistical test of hypotheses
Q9: A company manufactures U-100 insulin syringes
Q10: You measure the lifetime of a random
Q11: An herbal medicine brand contains amounts of