Multiple Choice
Here is a histogram of T-cell velocities in vitro (in microns per minute) :
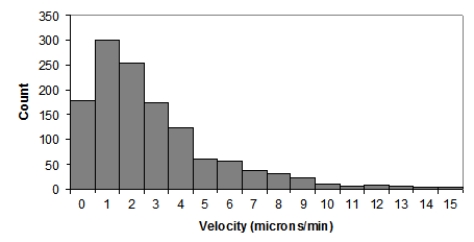
Which of the following statements is NOT true?
A) The population distribution of T-cell velocities is most likely skewed to the right.
B) The distribution of T-cell velocities would be more Normal if the researchers had collected more data.
C) When n is large, the sampling distribution of average T-cell velocities is approximately Normal.
D) The sampling distribution of average T-cell velocities for samples of size n = 10 is very likely right-skewed.
Correct Answer:

Verified
Correct Answer:
Verified
Q12: The level of nitrogen oxides (NO<sub>x</sub>) in
Q13: A national survey by Gallup interviewed 1014
Q14: The mean of the sampling distribution p̂
Q15: The pH measurements of water specimens from
Q16: Suppose a large population has mean μ
Q18: The average age of trees in a
Q19: The state of California reported a total
Q20: Which of the following statements is NOT
Q21: As many as 20% of all Americans
Q22: Cats live for 14 years, on average,