Multiple Choice
A researcher was interested in the survival times of brook trout after their exposure to increased levels of total dissolved solids. The following quantile-quantile plot was obtained: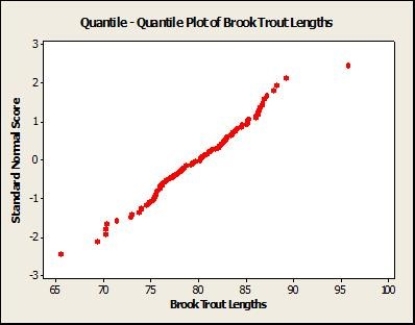 Based on this graph, what is the best description of the data?
A) Standard Normal
B) Normal, but not standard Normal
C) Skewed left
D) Skewed right
Correct Answer:

Verified
Correct Answer:
Verified
Q11: A researcher is interested in the lengths
Q12: The distribution of vitamin C amount in
Q13: Serum albumin levels in adults are distributed
Q14: When using your calculator to find the
Q15: The distribution of total body protein in
Q17: Serum albumin levels in adults are distributed
Q18: Birth weights at a local hospital have
Q19: The amount of cholesterol in a person's
Q20: X has a Normal distribution with mean
Q21: Which of the following statements is true