Multiple Choice
The following Normal quantile plot displays the body temperature (in degrees Celsius) of a sample of 129 healthy adults: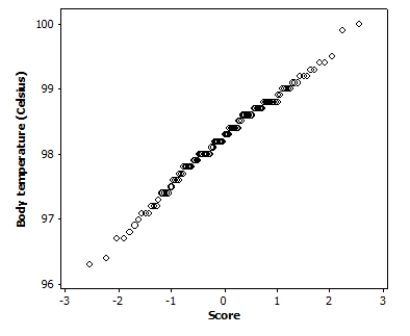 Based on this graph, what is the best description of the distribution of body temperatures?
A) Linear
B) Roughly Normal
C) Bimodal
D) Skewed
Correct Answer:

Verified
Correct Answer:
Verified
Q17: Serum albumin levels in adults are distributed
Q18: Birth weights at a local hospital have
Q19: The amount of cholesterol in a person's
Q20: X has a Normal distribution with mean
Q21: Which of the following statements is true
Q23: Using fluorescent imaging techniques, researchers observed that
Q24: The amount of cholesterol in a person's
Q25: The distribution of total body protein in
Q26: The distribution of total body protein in
Q27: The pH measurements of water specimens from