Multiple Choice
The birth weights of a random sample of 26 baby boys are displayed in the following Normal quantile plot: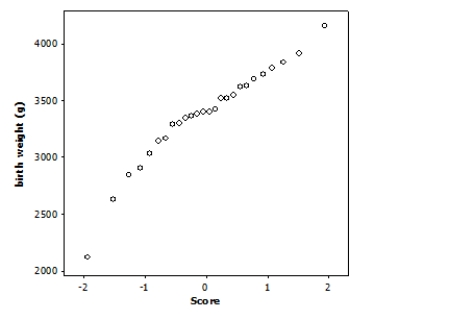 Based on this graph, what is the best description of the data?
A) The distribution has a low outlier.
B) The distribution is approximately Normal.
C) The distribution is skewed to the right.
D) The distribution is bimodal.
Correct Answer:

Verified
Correct Answer:
Verified
Q33: A researcher is interested in the lengths
Q34: The distribution of total body protein in
Q35: Using fluorescent imaging techniques, researchers observed that
Q36: A researcher is interested in the lengths
Q37: A stemplot of a set of data
Q38: Using fluorescent imaging techniques, researchers observed that
Q40: The distribution of total body protein in
Q41: The heights of adult males are approximately
Q42: The pH measurements of water specimens from
Q43: The lengths of 1-year-old girls can be