Multiple Choice
The following histogram depicts the prevalence rates of a particular genetic marker in samples among 25 impoverished communities in 2004. In each interval, the left endpoint is included but not the right endpoint, so the class intervals are 10 ≤ rate < 15, 15 ≤ rate < 20, . . . .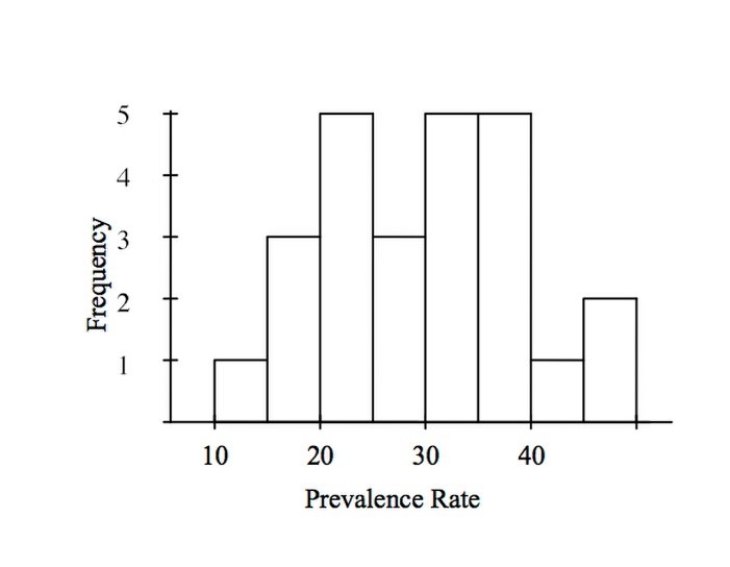
How many communities have a prevalence rate of 30% or higher?
A) 5
B) 12
C) 10
D) 13
Correct Answer:

Verified
Correct Answer:
Verified
Q9: Here are records of eye color
Q10: The EPA sends out a survey to
Q11: Every month, the Gallup polling organization tracks
Q12: For a biology lab course containing
Q13: The following histogram shows the yearly number
Q15: During winter, red foxes hunt small rodents
Q16: During winter, red foxes hunt small rodents
Q17: Some variables were recorded while surveying plants
Q18: A survey is conducted among students taking
Q19: Which of the following is a discrete