Essay
The plot below describes the relationship between the time spent in hours watching television per week (y-axis) and the time it takes to run half a mile in minutes (x-axis) in a sample of individuals.
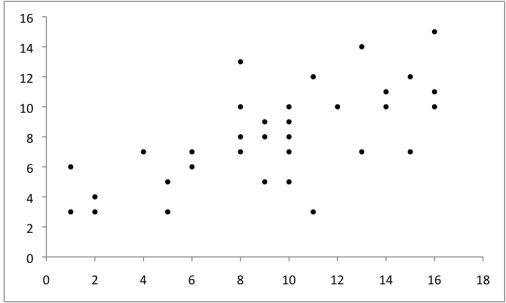 Does the graph illustrate a univariate or bivariate display? What does the graph tell you about the relationship between the two variables?
Correct Answer:

Verified
Bivariate; there appears to be...View Answer
Unlock this answer now
Get Access to more Verified Answers free of charge
Correct Answer:
Verified
View Answer
Unlock this answer now
Get Access to more Verified Answers free of charge
Q20: The sampling distribution of means with a
Q21: The probability of committing a Type I
Q22: Stephanie is designing an experiment to investigate
Q23: Stem-and-leaf plots are most suited for displaying
Q24: In Alison's study, the Pearson's r of
Q26: Which of the following groups of data
Q27: Which of the following is true when
Q28: Which of the following is a valid
Q29: The data below are from Jason's study
Q30: State two criticisms of null hypothesis significance