Multiple Choice
3) A problem with the chart shown below is that: Figure 1 Mean reading times (secs.) for trained and untrained groups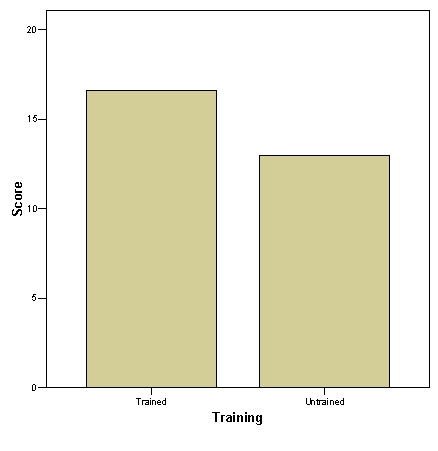
A) The X axis labelling is inadequate
B) The Y axis labelling is inadequate
C) The Y axis starts from zero
D) The two bar columns should be joined together
Correct Answer:

Verified
Correct Answer:
Verified
Related Questions
Q1: 1) In a bar chart:<br>A) It is
Q2: 9) A frequency polygon:<br>A) Shows the mean
Q3: 7) In a bar chart:<br>A) Columns cannot
Q4: 4) In a histogram:<br>A) Columns can represent
Q5: 6) When putting charts into reports:<br>A) It
Q6: 2) The following stem and leaf
Q8: 10) A stem and leaf chart:<br>A) Does
Q9: 5) A bar chart representing scores from
Q10: 8) Which of the following is true:<br>A)