Multiple Choice
Which of the following graphs is most likely to represent the acceleration of an athlete during a 100 m sprint? 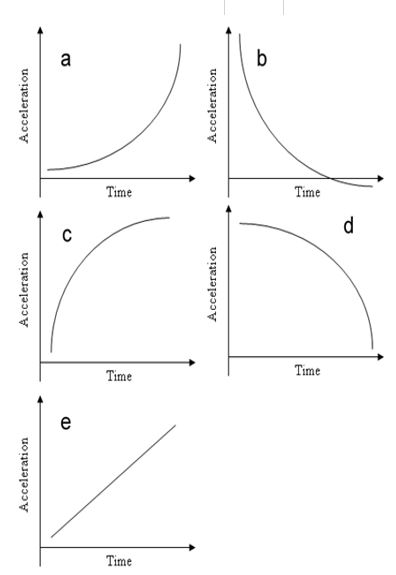
A) Image a
B) Image b
C) Image c
D) Image d
E) Image e
Correct Answer:

Verified
Correct Answer:
Verified
Related Questions
Q41: A volleyball player performs a standing vertical
Q42: How many kilometres is 1 mile<br>A) 1.609<br>B)
Q43: How far does the athlete travel at
Q44: What are the first and second conditions
Q45: Dynamic equilibrium is:<br>A) When an object or
Q47: Distance is:<br>A) A vector quantity where direction
Q48: Explain how the units of m/s<sup>2</sup> for
Q49: Convert 3 hours 23.6 minutes into minutes
Q50: Figure A4.5<br> <img src="https://d2lvgg3v3hfg70.cloudfront.net/TBR1297/.jpg" alt="Figure A4.5
Q51: The table below contains data from the