Multiple Choice
Please refer to the following art to answer the following question(s) .

-The figure below shows the growth curves of two populations of Paramecium,P.aurelia and P.caudatum.From the data,we can conclude that ______. 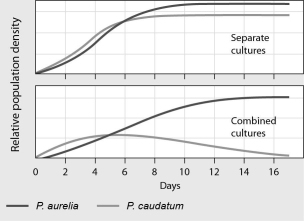
A) the ecological niches of the two species are very different
B) P. aurelia is a predator of P. caudatum
C) P. aurelia and P. caudatum have a mutualistic relationship
D) P. aurelia is the superior competitor in this habitat
Correct Answer:

Verified
Correct Answer:
Verified
Q3: The atmosphere is approximately 80% _ gas.<br>A)
Q4: A regional assemblage of interacting ecosystems is
Q5: Several years ago,I was crossing the border
Q6: _ convert nitrogen from a form that
Q9: Plants can utilize the _ form of
Q33: The rate at which an ecosystem's producers
Q34: In order to assess the species diversity
Q36: Approximately what percentage of the visible light
Q46: Bears eat berries,humans,and large fish; large fish
Q50: The single greatest threat to biodiversity comes