Multiple Choice
Refer to the figure.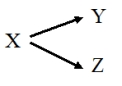 According to the theoretical model,
A) the inferred causal relationship between Y and Z is weak.
B) X is an intervening variable.
C) X affects Y and Z, but there is no causal relationship between Y and Z.
D) Y and Z are independent of X.
Correct Answer:

Verified
Correct Answer:
Verified
Q1: According to Box 12.3, "collinearity" refers to
Q2: For the 2018 GSS, you regress number
Q3: Some data-processing activities can be programmed into
Q4: Which of the following most accurately describes
Q5: Suppose a researcher finds a statistically significant
Q7: Using the 2018 GSS, we regressed the
Q8: Univariate analysis can determine whether to recode
Q9: Suppose two variables are negatively related. Which
Q10: Describe the differences in the bivariate analysis
Q11: Examining a scatterplot can reveal whether a