Essay
Refer to the figure.
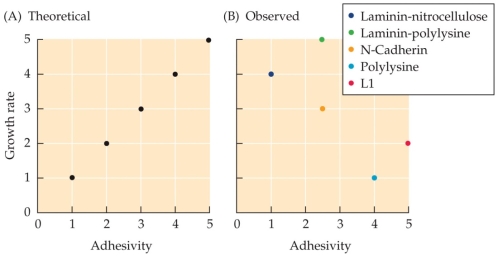 These data are from an experiment using growth cones cultured on substrates with different levels of adhesivity, ranked from least adhesive (laminin-nitrocellulose) to most adhesive (L1). Based on the theoretical prediction in graph A, what was the researchers' hypothesis about adhesivity and growth cone growth rate? Based on the observed data in graph B, how does growth rate actually correlate to adhesivity? What does this suggest about the role of adhesion in axonal growth?
Correct Answer:

Verified
Correct Answer:
Verified
Q17: Neurons that send axons across the midline
Q18: In growth cone guidance, what is the
Q19: What provides a structural core to an
Q20: In the experiment that led to Sperry's
Q21: What mechanism of axonal growth do the
Q23: Motor neuron axons are<br>A) attracted to ephrins.<br>B)
Q24: Ramón y Cajal's visualization of growth cones
Q25: What is one possible reason that the
Q26: Guidance cues can attract growth cones by
Q27: Which of the following is a receptor