Multiple Choice
What (approximate) correlation is shown in the following scatterplot: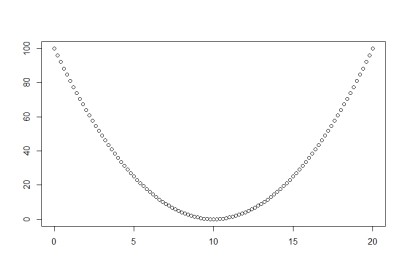
A) 0.50
B) 1.00
C) Impossible to say without the data.
D) 0.00
Correct Answer:

Verified
Correct Answer:
Verified
Related Questions
Q1: Then I used the same data to
Q2: A researcher looks at the relationship between
Q3: Which of the following is true:<br>A) If
Q4: The standard error of a correlation coefficient
Q6: I asked students to measure their heights
Q7: A researcher finds that orchestra conductors tend
Q8: A researcher wants to examine the relationship
Q9: We should be concerned about possible outliers
Q10: Which of the following sets of values
Q11: Regression analysis, rather than correlation might be