Multiple Choice
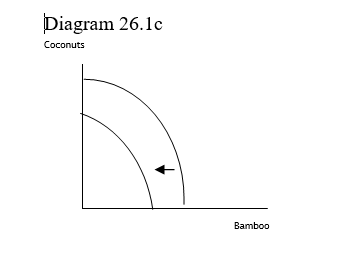
-The shift in the production possibilities curve shown in Diagram 26.1c reflects
A) an increase in resources used in the production of both goods.
B) a decrease in resources used in the production of both goods.
C) an decrease in resources used in the production of bamboo only.
D) an decrease in resources used in the production of coconuts only.
Correct Answer:

Answered by ExamLex AI
Correct Answer:
Answered by ExamLex AI
Q13: What is the definition of opportunity cost?<br>A)
Q14: Whats defention of terms:<br>-comparative Advantage
Q15: Explain why and how changes in technology,
Q16: List the assumptions behind the PPC<br>-What does
Q17: Describe how the production possibilities curve captures
Q19: What is the attitude of neoclassical economists
Q20: What do progressive economists mean by the
Q21: Whats defention of terms:<br>-Institutions
Q22: Use the PPC to illustrate scarcity, choice,
Q23: Whats defention of terms:<br>-scarcity