Multiple Choice
The shaded region of the figure below represents: 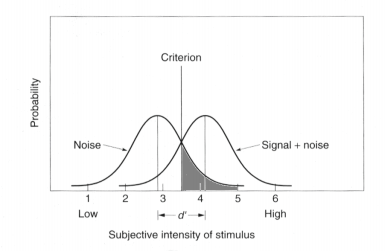
A) the proportion of correct rejections
B) the proportion of false alarms
C) the proportion of hits
D) the proportion of misses
Correct Answer:

Verified
Correct Answer:
Verified
Related Questions
Q21: The distributions below show the results from
Q22: An observer that adopts a conservative criterion
Q23: The ROC curve below presents the results
Q24: The graph below shows the results for
Q25: After Paul participates in a detection task,
Q27: The distributions below show the results from
Q28: The shaded region of the figure below
Q29: Erin participates in an experiment in which
Q30: Hubel and Wiesel are known for their
Q31: After Peter participates in a detection task,